

Cualquier integración gestionada por Home Assistant genera multitud de datos que puedes convertir en información válida con atractivos gráficos estadísticos.
Vemos cómo hacerlos sin salir de Home Assistant, con las tarjetas integradas de serie y con la magnífica tarjeta ApexCharts.
Puedes ver el vídeo aquí:

Te dejo a continuación el código para todos los gráficos que hemos visto en el vídeo:

type: gauge
entity: sensor.consumo_agua_por_ducha
needle: true
severity:
  green: 0
  yellow: 10
  red: 25
min: 0
max: 80
type: custom:apexcharts-card
header:
  show: true
  title: Últimas 24 horas
  show_states: false
  colorize_states: true
graph_span: 1d
all_series_config:
  stroke_width: 1
  opacity: 0.5
experimental:
  brush: true
series:
  - entity: sensor.consumo_agua_termo_electrico_instantaneo
    name: Eléctrico
    color: green
    show:
      legend_value: false
      in_brush: true
  - entity: sensor.termogas_v2_consumo_agua_termo_gas_instantneo
    name: Gas
    color: red
    show:
      legend_value: false
      in_brush: true
type: custom:apexcharts-card
apex_config:
  chart:
    stacked: true
  yaxis:
    - id: izq
      text: Litros
      max: 250
    - id: izq2
      text: Litros
      max: 250
      show: false
    - id: der
      text: Número duchas
      max: 12
      opposite: true
graph_span: 14d
span:
  end: day
header:
  show: true
  title: Litros diarios
  show_states: true
  colorize_states: true
series:
  - entity: sensor.consumo_agua_termo_electrico_diario
    name: Eléctrico
    type: column
    yaxis_id: izq
    unit: ' L'
    color: green
    group_by:
      func: last
      duration: 1d
    show:
      extremas: true
  - entity: sensor.consumo_agua_termo_gas_diario_2
    name: Gas
    type: column
    yaxis_id: izq
    unit: ' L'
    color: red
    group_by:
      func: last
      duration: 1d
    show:
      extremas: true
  - entity: counter.duchas_diarias
    name: Número duchas
    type: line
    yaxis_id: der
    color: blue
    group_by:
      func: last
      duration: 1d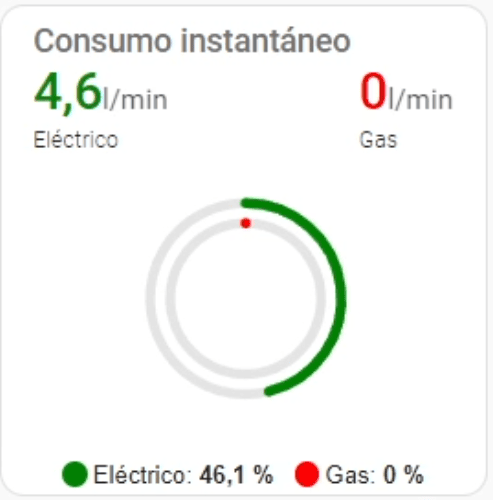
type: custom:apexcharts-card
header:
  show: true
  title: Consumo instantáneo
  show_states: true
  colorize_states: true
chart_type: radialBar
series:
  - entity: sensor.consumo_agua_termo_electrico_instantaneo
    name: Eléctrico
    min: 0
    max: 10
    color: green
  - entity: sensor.termogas_v2_consumo_agua_termo_gas_instantneo
    name: Gas
    min: 0
    max: 10
    color: red
type: custom:apexcharts-card
header:
  show: true
  title: Duchas hoy
  show_states: true
  colorize_states: true
apex_config:
  legend:
    show: false
chart_type: radialBar
series:
  - entity: counter.duchas_diarias
    name: Hoy
    min: 0
    max: 12
    color: orange
type: entities
title: Gas
entities:
  - entity: sensor.consumo_agua_termo_gas_diario_2
    name: Hoy
    icon: mdi:water-pump
  - entity: sensor.consumo_agua_termo_gas_mensual
    name: Mes
    icon: mdi:water-pump
  - entity: sensor.consumo_agua_termo_gas_anual
    name: Año
    icon: mdi:water-pump
theme: Catppuccin Latte
type: entities
title: Eléctrico
entities:
  - entity: sensor.consumo_agua_termo_electrico_diario
    icon: mdi:water-pump
    name: Hoy
  - entity: sensor.consumo_agua_termo_electrico_mensual
    icon: mdi:water-pump
    name: Mes
  - entity: sensor.consumo_agua_termo_electrico_anual
    icon: mdi:water-pump
    name: Año